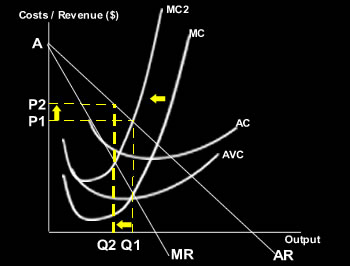
The diagram shows the impact of an increase in
on a monopoly.
Before the increase in variable costs, the profit maximising output - where
is at point
in the diagram.
Wih an increase in variable costs, marginal cost will shft to the left to
. The profit maximising output is now at point
. This is where
is equal to MR.
At Q2, consumer are willing to pay price
which is determined by the
curve. If the firm continued to produce at Q1 the
would be greater than
and the firm would be making marginal
on the extra output produced. Any quantity less than Q2 and the firm would not be gaining all
. (
is less than
).
At any output less than or more than Q2, total profits would be
and so the firm is maximising its profit after the increase in variable costs at point
, which is at output
.