| SUPPLY | |||||||||||||
| OBJECTIVES: | |||||||||||||
|
|||||||||||||
|
Supply is the quantity or amount of goods and services that a producer
is willing and able to provide / produce at a certain price. The higher
the price of a commodity the more the producer is willing to provide,
because the will make more profit. As the price of a commodity increases the producer makes more profit and so is willing to provide more of the good. For the quantity supplied to increase though, the producer has to be both willing and able to provide more of the commodity. If the price increases they will make more profit and so they are willing to provide more but they have to be able to provide more as well. |
|||||||||||||
| A supply schedule is used to show how much a producer is wiling to provide / supply at a range of prices. | |||||||||||||
| Below is a supply schedule for Grace the owner of Gracie's Mighty Milk factory. The schedule shows the quantity of milk Grace is willing to supply at a range of prices. | |||||||||||||
 |
|
||||||||||||
| From the supply schedule we can derive the law of supply. | |||||||||||||
| As price increases the quantity supplied increases. | |||||||||||||
|
|||||||||||||
| From the information contained in the above supply schedule we can construct a supply curve. | |||||||||||||
 |
|||||||||||||
| Things to note: the titles of both the supply
schedule and supply curve. On the graph both axis have been clearly
labelled, along with the supply curve (line). The line passes through
all the points (not the line of best fit). Remember the acronym T.A.L.L. to help remember what you need in a graph. Title, Axis, Labels and Line. |
|||||||||||||
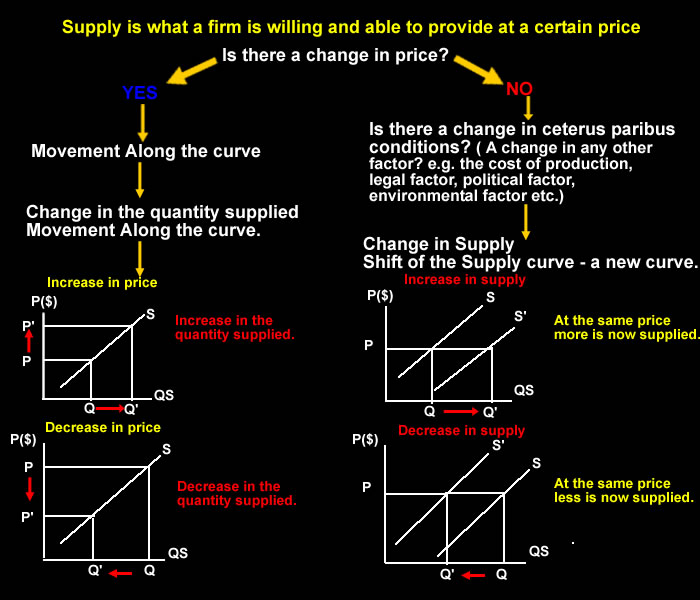
| MOVEMENTS ALONG THE SUPPLY CURVE. | |||||||||||||
| A movement along the supply curve will only result from a change in price. (assuming ceteris paribus). An increase in price will result in a movement up along the supply curve. | |||||||||||||
|
|||||||||||||
| We can see the impact of price changes in the movies below. | |||||||||||||
|
|
|||||||||||||
| FACTORS AFFECTING THE SUPPLY OF GOODS AND SERVICES. | |||||||||||||
| There are many factors that affect the producers decision to supply a good or service. They can be divided in to two main categories. | |||||||||||||
| Economic factors | |||||||||||||
| These are the factors that are directly related to the business and over which the business has some control. These factors include things like | |||||||||||||
| The
costs of production.
This includes the costs of resources such as
labour (wages) and raw materials. The cost of services is also an
influencing factor. Transport is a major cost of production for many
firms. |
|||||||||||||
| The price of the good. | |||||||||||||
| The
price of related goods. Goods that use the same inputs into the production process. A change in the price of one good can have an impact on the supply of the other good. |
|||||||||||||
| The cost of services, like insurance, electricity, water etc. | |||||||||||||
| Technology. | |||||||||||||
| Mechanisation, automation, computerisation, e-commerce , cell phone technology, are all new technologies that have helped firms to reduce their costs of production. It helps the business to work more efficiently causing the supply curve to shift right. | |||||||||||||
| Non-economic factors | |||||||||||||
| Legal
factors Such as rules and regulation by the government. These include things like the resource management act, employment regulations, health and safety regulations, zoning laws for a city council etc. The Resource Management Act is a law / regulation that has had a major influence on business costs in NZ. It aims to ensure that businesses take into account environmental factors when using their land. City councils zone business into particular areas to try and ensure that business does not conflict with residential housing. OSH –Occupational Health and Safety tries to ensure a minimum standard of safety at places of business. Minimum wage legislation means that no one can be employed for below the minimum wage ($9.50 for adults). |
|||||||||||||
| Political
Factors. Increase in government spending in times of recession can help create jobs. |
|||||||||||||
| Indirect
taxes are often placed on goods. Indirect taxes include GST (Goods and Services tax). Taxes put on demerit goods (alcohol etc.) A tax may be put on for a good the government or society believes is bad for us – a demerit good e.g. alcohol. |
|||||||||||||
| Subsidies.
A subsidy is money paid to a firm to encourage the production of the
commodity. A subsidy lowers the cost of production. A subsidy may be put on for a good the government or society believes is good for us – a merit good e.g. education. |
|||||||||||||
|
Environmental Factors. Pollution, concern about the environment and the conservation of resources have started to impact on the may many business’ produce goods. The flatulence tax that was to be introduced in NZ is an example of this. The Kyoto Agreement is also another example- it aims to reduce CO2 emission into the atmosphere and looks at placing a tax on companies that produce CO2, methane or other green house gases. Companies that pollute may have an advantage with their cost of production as they don’t try to clean up their production. Regulations help to protect the environment from firm’s that don’t take care. |
|||||||||||||
| Trade
factors. Quotas – a restriction on the amount of goods or service allowed into the economy. Tariff – a tax placed on goods being imported into a country. Both of these two methods are used to help protect local industry. |
|||||||||||||
| SHIFTS OF THE SUPPLY CURVE. | |||||||||||||
| As we saw earlier the only thing that can cause a movement along the supply curve is a change in price. | |||||||||||||
| A change in anything else will cause a shift of the supply curve, which means there will be a whole new curve. | |||||||||||||
| So a change in any of the following will cause the supply curve to shift. | |||||||||||||
|
|||||||||||||
|
|
|||||||||||||
| A change
in price will cause a movement along the supply curve and a change in
the quantity supplied. A change in any other factor will cause a shift of the supply curve and a change in supply. |
|||||||||||||
|
RELATED GOODS (ALTERNATIVE GOODS) |
|||||||||||||
| In some cases a firm may have more than one choice about what kind of good it will produce from the same input. | |||||||||||||
| IMPLICATIONS OF A SHIFT OF THE SUPPLY CURVE TO THE LEFT (A DECREASE IN SUPPLY) | |||||||||||||
|
|||||||||||||
| IMPLICATIONS OF A SHIFT OF THE SUPPLY CURVE TO THE RIGHT (AN INCREASE IN SUPPLY) | |||||||||||||
|
|||||||||||||
| SUMMARY | |||||||||||||
 |
|||||||||||||