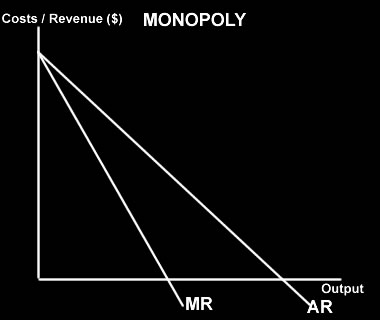
MONOPOLY The monopolist does not share the market with anyone. The market demand curve is downward sloping and is the demand curve facing the firm. AR for a monopolist is a downward line showing they have to reduce price in order to sell more. For a monopolist MR will fall twice as fast as AR because the monopolist has to reduce price in order to sell more. When drawing AR and MR curves for a monopolist, you need to take note of the following
A monopolist faces the market demand curve, and can determine what price to charge OR the quantity to supply. |
 |
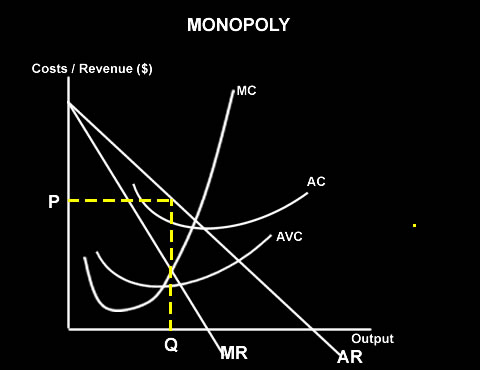
PROFIT MAXIMISING OUTPUT FOR A MONOPOLY. Like a perfect competitior this is where MC = MR - the firm will maximise profits / minimise losses at this point. However for a monopoly AR is different and so, as shown in the diagram, output is at point Q, where MC is equal to MR, but the price is determined by the demand or AR curve and so the price is at P. |
 |
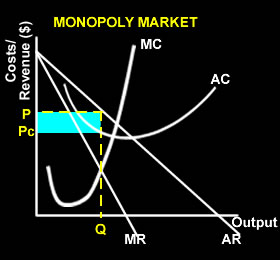
IN THE LONG-RUN A MONOPOLIST CAN CONTINUE TO MAKE SUPER NORMAL PROFITS. BECAUSE OF LARGE BARRIERS TO ENTRY, OTHER FIRMS CANNOT ENTER THE MARKET IF A SUPER NORMAL PROFIT IS BEING MADE AND SO THE MONOPLIST CAN CONTINUE TO MAKE LARGE PROFITS. |
|
MONOPOLY AND SUPER NORMAL PROFITS. In the long-run a monopolist can continue to make super normal profits. - Monoplies have strong barriers to entry. - Monoplies have no close substitutes. |
 |
Compared with a perfectly competitive market.
|
|
| MONOPOLIES AND ALLOCATIVE INEFFICIENCY | |
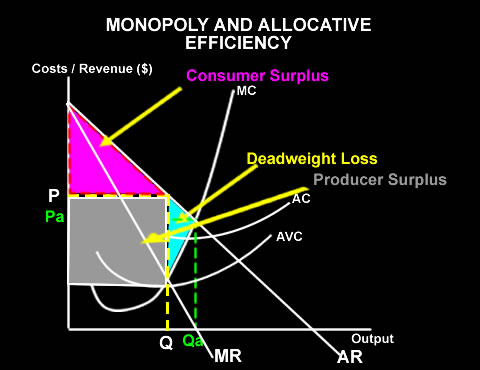
Because the demand curve is downward-sloping and the MR curve is less than AR, the monopolistic firm will deliberately restrict output to where MC = MR. The profit maximising level of output will be less than is allocatively efficient because the demand and supply curves do not intersect.
Therefore the monopoly situation is not allocatively efficient.
|
 |