|
Demand Schedules and Curves | ||||||||||||||||||||||||||||||||
| OBJECTIVES: | ||||||||||||||||||||||||||||||||
|
-Describe
the influences that affect the demand for goods/services. | ||||||||||||||||||||||||||||||||
Consumer demand | ||||||||||||||||||||||||||||||||
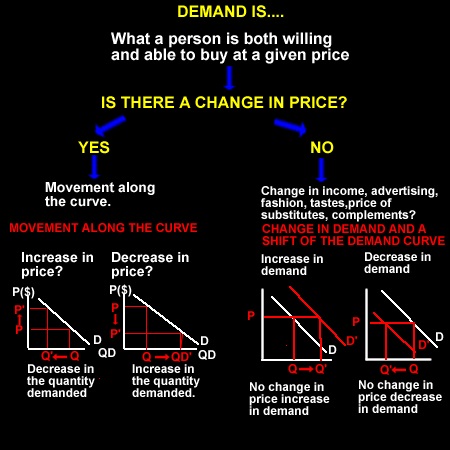
| Demand is what a consumer is both willing and able to buy at a given price | ||||||||||||||||||||||||||||||||
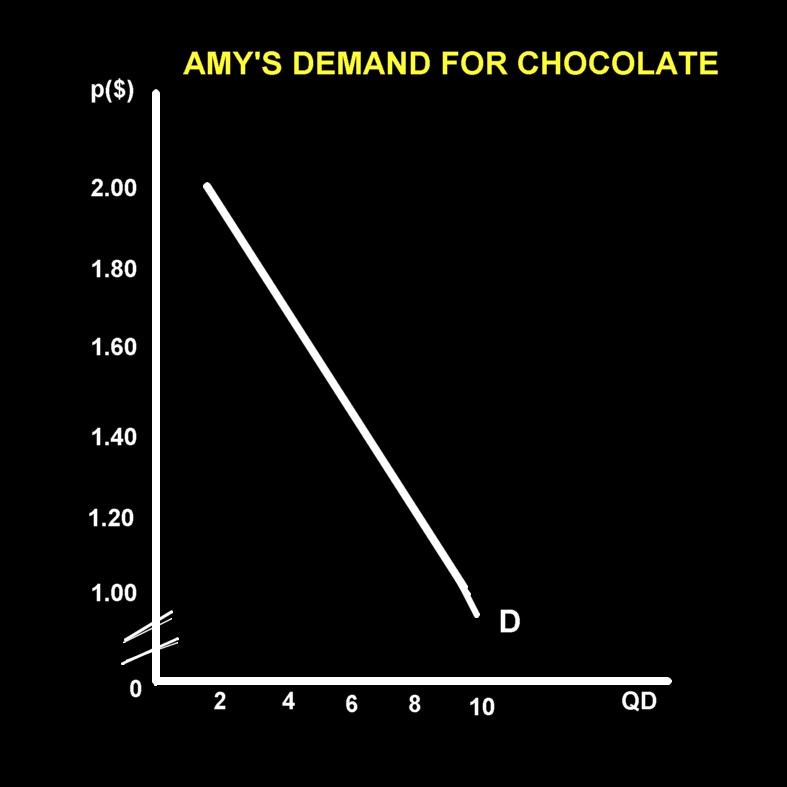
| A demand schedule | ||||||||||||||||||||||||||||||||
| Sets down the quantity demanded at each price. From this can be drawn onto a demand curve. DEMAND SCHEDULE FOR AMY'S DEMAND FOR CHOCOLATE
| ||||||||||||||||||||||||||||||||
A demand schedule must always have
the following
As we can see from the demand schedule as the price increases the quantity demanded decreases. This gives us the LAW OF DEMAND as price increases the quantity demanded decreases, ceteris paribus. Price and quantity demanded are the only variables shown in
a demand schedule. | ||||||||||||||||||||||||||||||||
| ||||||||||||||||||||||||||||||||
| From a demand schedule we can draw a demand curve as shown below. | ||||||||||||||||||||||||||||||||
 |
THINGS TO
REMEMBER When making a table remember the acronym T.A.L.L.
|
|||||||||||||||||||||||||||||||
| ||||||||||||||||||||||||||||||||
| ||||||||||||||||||||||||||||||||
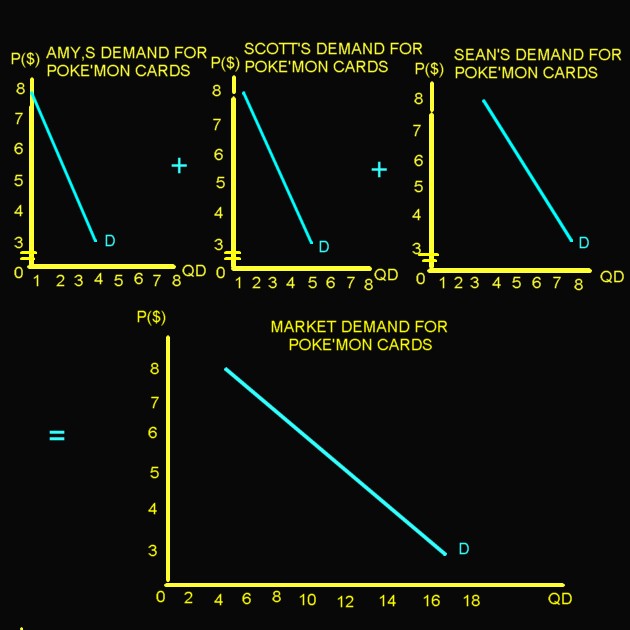
Market demand | ||||||||||||||||||||||||||||||||
| Market demand is the horizontal summation of each individuals demand at each price. | ||||||||||||||||||||||||||||||||
|
Market Demand Schedule For Poke'mon Cards | ||||||||||||||||||||||||||||||||
| ||||||||||||||||||||||||||||||||
 | ||||||||||||||||||||||||||||||||
Movement along the demand curve | ||||||||||||||||||||||||||||||||
| Change in quantity demanded. | ||||||||||||||||||||||||||||||||
| A change in price will cause a change in the quantity demanded and a movement along the demand curve. | ||||||||||||||||||||||||||||||||
| Example: | ||||||||||||||||||||||||||||||||
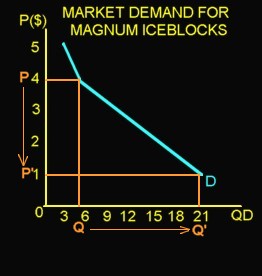 |
A change in price of
Magnums from $4 to $1 has increased the quantity demanded from 6 to 21.
Note:
| |||||||||||||||||||||||||||||||
| - If price for the ice blocks falls from $4 to $1 then quantity demanded increases from 6 ice blocks to 21 ice blocks.. | ||||||||||||||||||||||||||||||||
| - The reverse happens if price rises then quantity demanded decreases. | ||||||||||||||||||||||||||||||||
| ||||||||||||||||||||||||||||||||
| A Movement along the curve is caused only by a change in price resulting in a new quantity demanded, assuming ceteris paribus. | ||||||||||||||||||||||||||||||||
Demand curve shifts | ||||||||||||||||||||||||||||||||
| Change in demand. | ||||||||||||||||||||||||||||||||
| A change in any
other factor (not price) will cause a shift of the demand curve (a whole
new demand curve) and a change in demand. This means that at the same price there will be a change in how much of the good or service is demanded. | ||||||||||||||||||||||||||||||||
| ||||||||||||||||||||||||||||||||
| Causes: | ||||||||||||||||||||||||||||||||
| 1. Income changes | ||||||||||||||||||||||||||||||||
Income can change due to :
| ||||||||||||||||||||||||||||||||
| An increase in income means that a consumer is more able to purchase a good or service. The consumer will now buy more of the good at the same price. This leads to an increase in demand and a shift of the curve to the right | ||||||||||||||||||||||||||||||||
| A decrease in income means that the consumer is now less able to buy the same amount of the commodity and so less of the good is brought at the same price. This leads to a shift of the demand curve to the left and a decrease in demand. | ||||||||||||||||||||||||||||||||
 |
NOTE:
If income increases
| |||||||||||||||||||||||||||||||
| A change of income shifts the complete curve and at the same price for a good more or less is bought. | ||||||||||||||||||||||||||||||||
| Income increased e.g. wage rise | ||||||||||||||||||||||||||||||||
| Income decreased e.g. income taxes rise | ||||||||||||||||||||||||||||||||
| Exception: | ||||||||||||||||||||||||||||||||
| When an income rise leads to an increase in demand for a good, we call it a normal good. If a rise in income leads consumers to demand less of a good, we call it an inferior good. For example, a rise in income may lead consumers to buy less baked beans and more meat, fewer sandshoes and more Nike sports shoes. The baked beans and sandshoes in these example are called inferior goods. | ||||||||||||||||||||||||||||||||
|
| ||||||||||||||||||||||||||||||||
| ||||||||||||||||||||||||||||||||
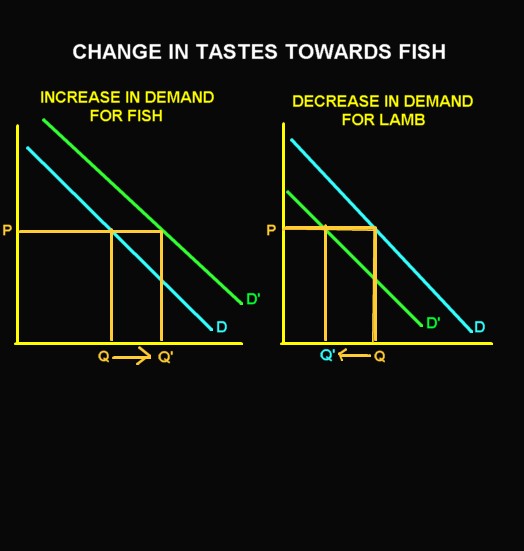
| 2. Tastes or fashion change | ||||||||||||||||||||||||||||||||
| Tastes or fashion may change because, for example, it is advertised that alcohol causes a lot of social problms or tabbacco causes cancer; it found that fish is healthy and that lamb has become less popular recently,or there is change in season from summer to winter increasing the desire for warm clothes. | ||||||||||||||||||||||||||||||||
 |
Note:
| |||||||||||||||||||||||||||||||
| 3. Prices of other goods | ||||||||||||||||||||||||||||||||
| Substitute goods. | ||||||||||||||||||||||||||||||||
| A substittute good is one that can be used in place of another good - they can replace each other. If the price of one good increases then there will be an increase in demand for the other good as more people start to buy it. e.g.if the price of butter increased then the demand for margarine will increase as more people but it instead of butter. Other substitutes include tea and coffee; petrol and LPG; beef and chicken. | ||||||||||||||||||||||||||||||||
| Example: | ||||||||||||||||||||||||||||||||
| Suppose the price of Coke rises from $1 a can to $1.50 a can, then there will be an increase in demand for Pepsi because more people will be willing to buy pepsi as it is now comparativly cheaper. | ||||||||||||||||||||||||||||||||
 |
Note:
| |||||||||||||||||||||||||||||||
| Pepsi and Coke are substitute goods | ||||||||||||||||||||||||||||||||
| ||||||||||||||||||||||||||||||||
| Complementary goods | ||||||||||||||||||||||||||||||||
| These are goods used together e.g. cars and petrol; fish
and chips; bread and butter If the price of one changes then the demand for the other is affected. | ||||||||||||||||||||||||||||||||
| Example: | ||||||||||||||||||||||||||||||||
| If the price of petrol increases then there will be a decrease in the quantity demanded for petrol and a decrease in the demand for cars. | ||||||||||||||||||||||||||||||||
 |
Note
| |||||||||||||||||||||||||||||||
| Petrol and Cars are complementary goods. | ||||||||||||||||||||||||||||||||
| SUMMARY | ||||||||||||||||||||||||||||||||