| The Production Possibility Model | |
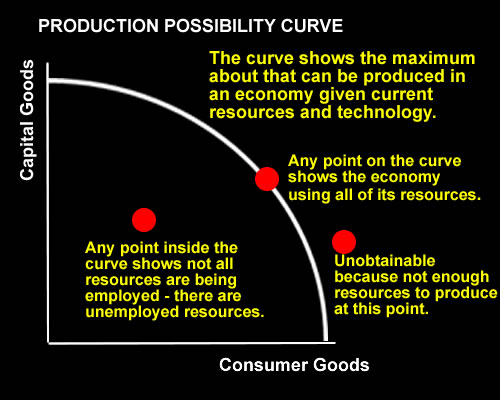
The model shows the maximum output combinations possible with the given amount of resources (factor endowments ) and technology that an economy may have. Resources are all of the factor endowmwnts which consist of
The PPF shows scarcity of resources because it cannot produce beyond this curve / line due to a lack of avaiable resources or technology. |
 |
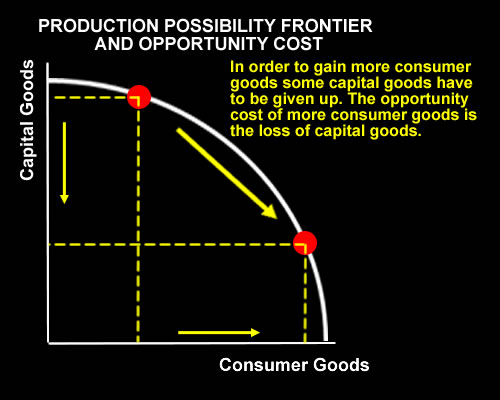
The Production Possibility Curve and Opportunity Cost. The PPC shows the key economic concepts of If the economy chooses to produce more of consumer goods it has to give up some Capital goods– that is the opportunity cost – the next best alternative foregone. Scarcity occurs due to our unlimited wants but limited means and resources and so we have to make choices about what to produce. With every choice made there is always an opportunity cost. |
 |
| Increasing Opportunity Cost | |
The curved PPF shows the principal of increasing opportunity cost. This means that in order gain more of one good greater amount of the other good have to be given up. In the diagram we can see that in going from 70 000 Consumer goods and 0 Capital goods at point A to 5 000 capital goods and 69 500 consumer goods at point B only 500 Consumer goods have to be given up. But in going from point B to C another 5 000 capital goods are gained, but this time 1000 consumer goods are given up. In going from C to D another 5 000 Capital goods are gained but this time 2 000 Consumer goods are given up. At the last point in going from G to H another This shows the principal of increasing opportunity cost - a greater amount of consumer goods have to be given up in order to gain the same amount of Capital goods. |
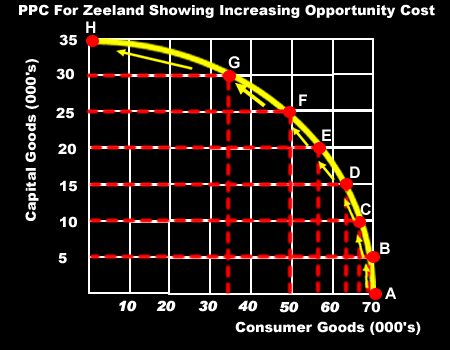 |
| The reason for this increasing opportunity cost is that some resources are more suited to the production of capital goods and some resources are more suited to the production of consumer goods. When production is changed from point A to point B, then the first resources that are given up in the production of consumer goods will be those resources that are better suited to the production of captal goods. This means that for the loss of only 500 consumer goods, 5 000 capital goods are gained. But as the production of capital goods increases, then more and more consumer goods will have to be given up to gain the same amount of capital goods as resources that are less and less suited to the production of capital goods are given up in order to increase production. The opportunity cost increases as the increase in the production of capital goods increases. |
|
| A SHIFT OF THE PPF | |
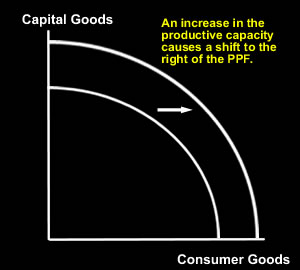
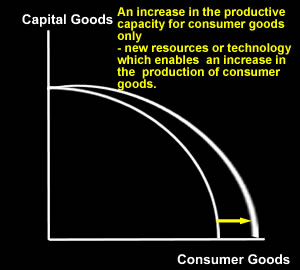
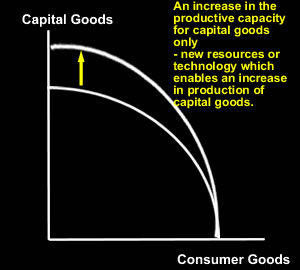
A shift outward of the PPC illustrates increased productive capacity and results in economic growth. Any shift out of the PPF shows that more resources have been discovered or the level of technology has improved. A shift outward (to the right) of the PPF shows that the productive capacity in the economy has increased. |
 |
| An increase in the productive capacity for consumer goods only - a change in resources or technology that only affects the production of Consumer Goods. |
An increase in the productive capacity for capital goods only - a change in resources or technology that only affects the production of Capital Goods. |
 |
 |
As the economy’s productive capacity is increased its ability to produce goods and services increases beyond the original PPC. The whole PPC is shifted outwards as a result of |
|
| An Increase In Growth / Employment | |
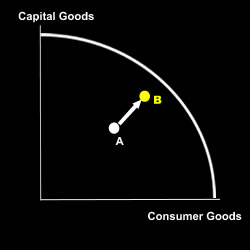
If this situation, growth has occurred as a result of a movement from inside the curve. A - at this point resources were being under-utilised and the economy had a lot of unemployed resources. In moving to point B the economy has growen - output has increased and the economy has moved closer to a point of full capacity or closer to the PPF. There is now less unemployment in the economy has more resources are now employed. |
 |
| Increase In PPF due to more Capial Good Being Produced. | |
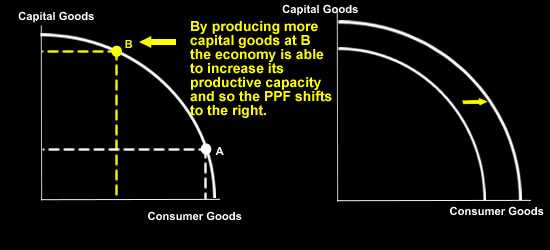
If a country chooses to concentrate on the production of capital goods it can extend its PPF in the future by giving itself more productive capacity through having more or newer capital (factories, machinery etc) or better technology which increases its efficiency and ability to produce more, thereby increasing its productive capacity. In effect the country is giving up on happiness now (consumer goods) being produced at point A for future growth and so producing more capital goods at point B. If the country chooses to produce at point B then it is sacrificing consumer happiness now for future growth – because it is producing more capital goods it will have a much higher potential growth rate in the future. If the country chooses to produce at point A then it is sacrificing future growth for consumer happiness now. Less capital goods produced means that there is less potential for growth in the future. |
 |