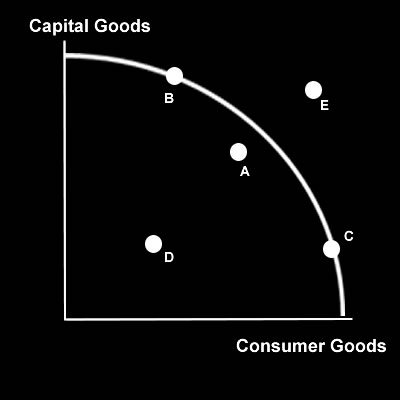
The following diagram shows a Production Possibility Curve or
.
The model shows the
output combinations possible with the given amount of resources and
that an economy may have.
In this way a PPF shows the key economic concepts of
of resources – the economy cannot produce outside the
this is the maximum amount of goods that can be produced in the economy, given available
.
If the economy chooses to produce more Capital Goods it has to give up some
that is the
– the next best alternative foregone.
The economy is producing at production efficiency at points
and
in the diagram. This means that all
are being used and the economy is at
.
Points
and
show the economy with unutilised resources, there is
and on the AD/AS model there would be a
. Point
shows the economy with a lot of unemployment and there would be a large
.
Point
shows a point that is currently
given the economy's current resources and level of
.
If the economy chose to produce at point
then there would be more potential for the economy to grow in the future, this is because at this point more resources are being produced increasing the economy's productive capacity.
Any point that is inside the PPF shows the economy having
. The current position of the New Zealand economy would best be shown by point
.