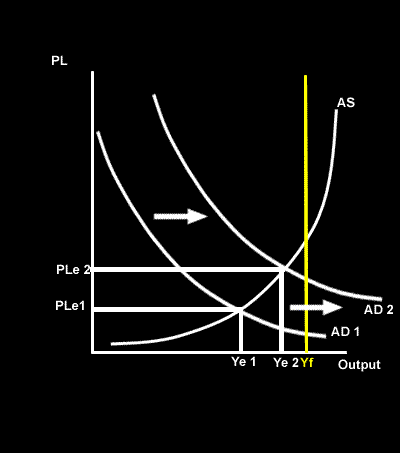
The following diagram shows the impact of an increase in aggregate demand.
is the total demand for goods and services at a given price level usually within a year.
Before the increase in AD there was a large
gap, this is where the equilibrium point of AD = AS is
the point of
(Yf). This means that there are
resources in the economy and there is
in the labour market.
The shift to the left of AD can be caused by such things as an increase in
(Y),
or consumer spending (C),
- which is the buying of capital goods (I),
(G) or an increase in
(X-M).
With an increase in AD the AD curve will shift to the right to AD2 and both the average price level (
) and
will increase.
This increase in output will cause an increase in
and the
will be reduced.
If there is a
then the government can help to reduce the gap by increasing government
,
tranfer payments or
income tax.
Decreasing income tax will mean consumers will have more
and so they are able to
more, save more or a combination of both. If they choose to spend more then
will increase and AD will shift to the right,
the recessionary gap.
An increase in
will mean that the government will be purchasing more goods and services and so firms
will increase, this causes a shift to he right of the AD curve and so both output and employment will
bringing the economy closer to
.